@misc{causalml,
  title        = {CausalML},
  author       = {Chen and Harinen and Lee and Zhao and others},
  howpublished = {\url{https://causalml.readthedocs.io/}},
  note         = {Software / documentation}
}Estimate who responds, not just the average. Fit a family of meta-learners on top of any base regressor, pick the winner on a held-out validation slice, then rank units by predicted uplift and read the cumulative-gain (Qini) curve against random — the operational payoff.
Input · what goes in
An outcome Y, a binary treatment W, and features X — typically from an experiment or a de-confounded observational sample.
Show data format & exampleHide example
Format — one row per unit: outcome y, treatment flag w, features X.
from causalml.inference.meta import BaseXRegressor
from xgboost import XGBRegressor
learner = BaseXRegressor(XGBRegressor())
cate = learner.fit_predict(X, treatment=w, y=y)
Pipeline · the recipe ⑂ has parallel branches
↑ Click any step in the diagram to read its logic, code, assumptions & discussion.
Outcome, treatment, features
Data preparation — shapes the raw inputs into what the estimator expects.
Assemble Y, the treatment flag W, and features X. The estimand is the conditional uplift τ(x).
# y outcome, w treatment (0/1), X features
- No comments on this step yet — be the first.
Log in to comment on this step.
Fit a family of meta-learners
The core estimate — where the causal quantity itself is computed.
S/T/X-learners build τ̂ from base outcome models; the R-learner targets it directly through a residualised loss (Robinson).
from causalml.inference.meta import (
    BaseSRegressor, BaseTRegressor, BaseXRegressor, BaseRRegressor)
- No comments on this step yet — be the first.
Log in to comment on this step.
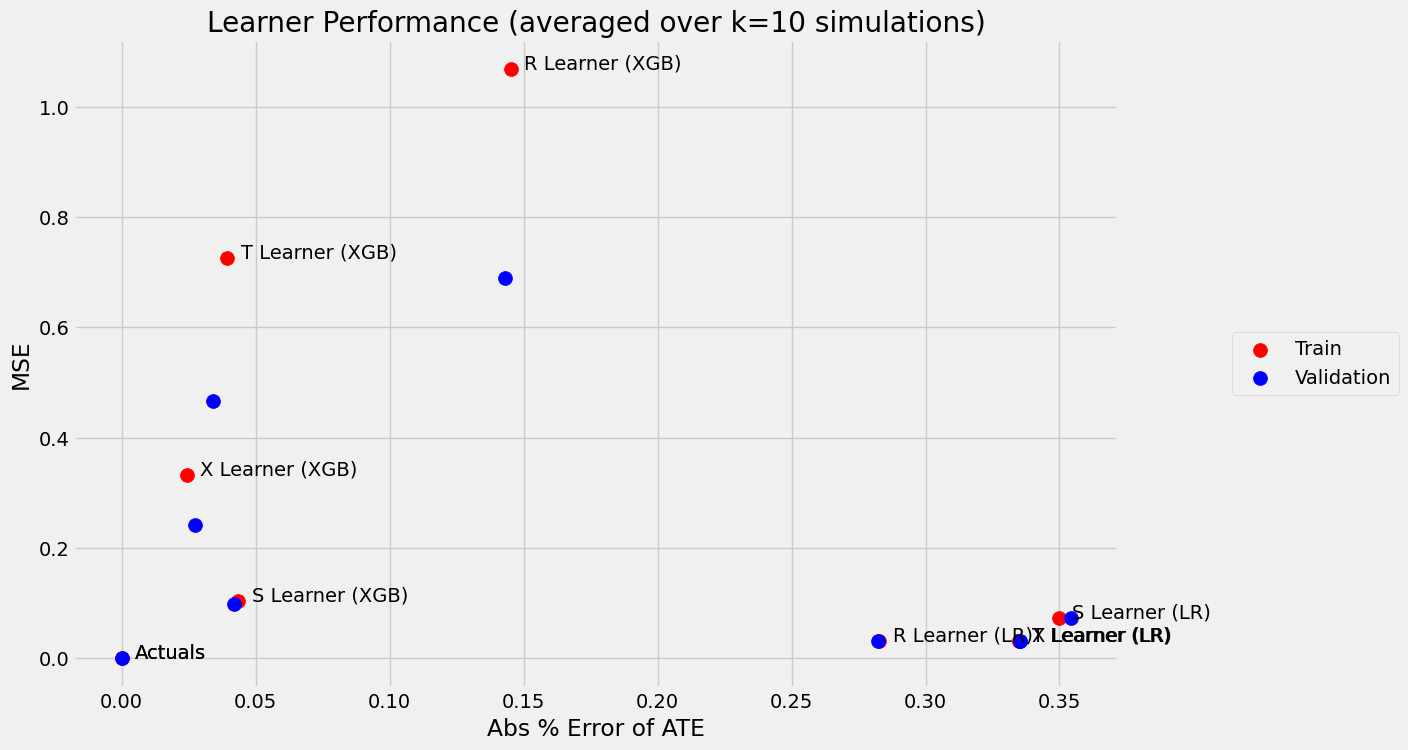
Compare learners; choose by validation
Heterogeneity — who is affected, and by how much, not just on average.
There's no single best meta-learner — score CATE error and ATE recovery on held-out data and let the data choose.
from causalml.metrics import get_cumgain
# compare S/T/X/R on a validation split
- No comments on this step yet — be the first.
Log in to comment on this step.
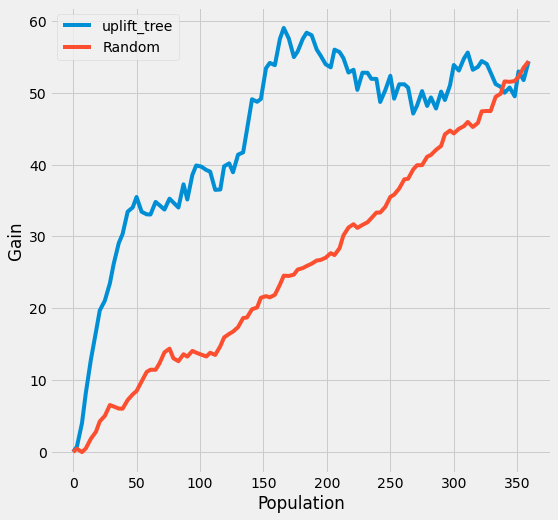
Targeting: uplift / Qini gain
Reporting — turn the numbers into a figure or table a reader can act on.
Rank units by predicted uplift and read the cumulative gain (AUUC/Qini) versus random — the operational payoff of the model.
from causalml.metrics import plot_gain, auuc_score
plot_gain(df)
- No comments on this step yet — be the first.
Log in to comment on this step.
Output · what you get 2 figures
Figures reproduced from CausalML — Uber (Chen, Harinen, Lee, Zhao et al.) — unofficial community showcase; all credit to the original authors.
⚠️ Unofficial community showcase of causalml. Not affiliated with the authors; all credit to them.
Estimate who responds, not just the average: fit a family of meta-learners for the CATE, pick the best by validation error, then rank and target with an uplift curve.
Discussion (2)
Log in to join the discussion.
The 'no single best meta-learner, score on validation' framing is right. I've watched the X-learner win and lose on the same product.
The uplift gain curve over random is the plot that actually convinces ops. Saved.