@misc{grf,
  title        = {grf},
  author       = {Athey and Tibshirani and Wager},
  howpublished = {\url{https://grf-labs.github.io/grf/}},
  note         = {Software / documentation}
}Cost-aware Qini curves with K treatment arms and per-unit costs — pick the arm and the budget jointly.
mainbranch
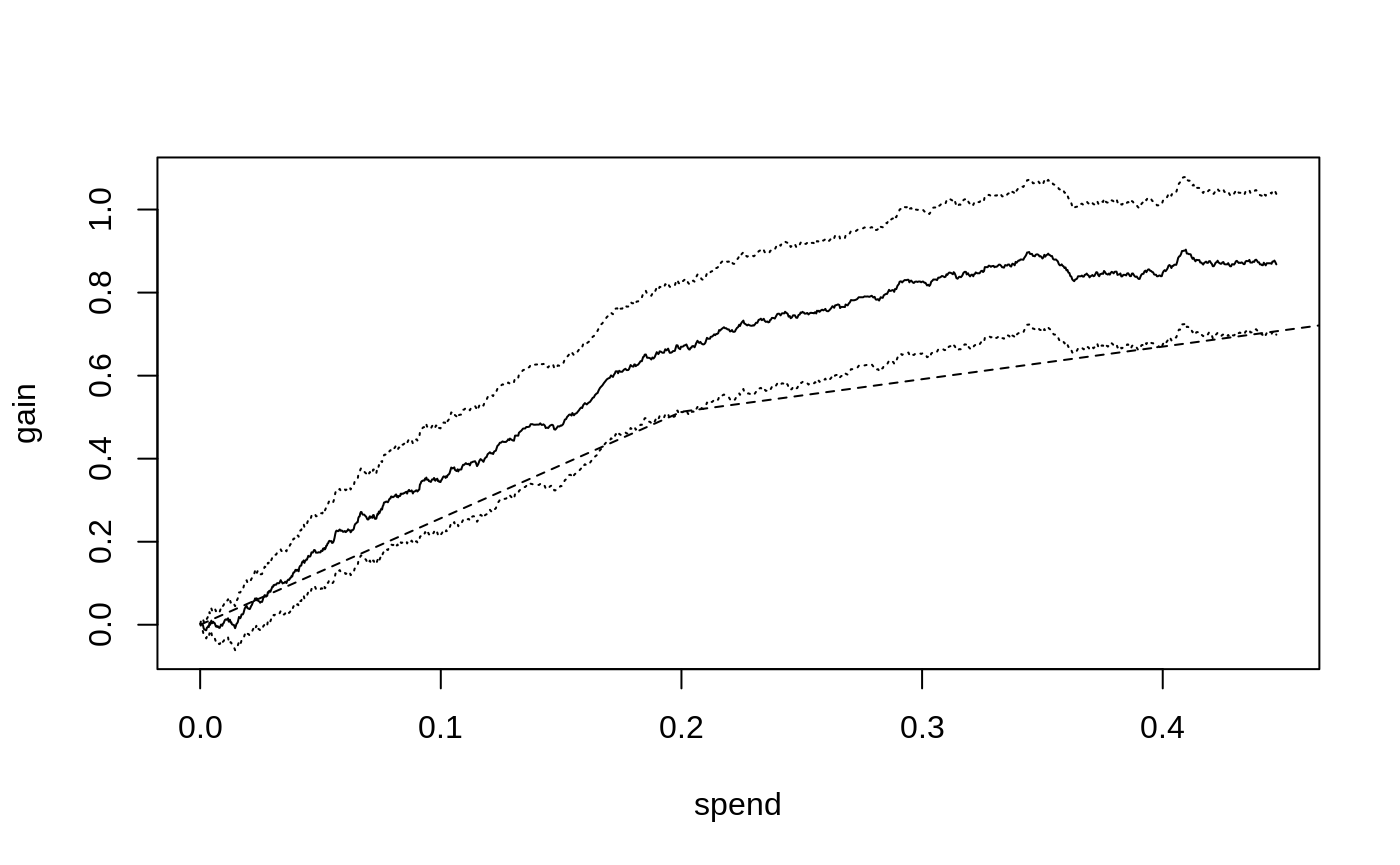
Figure: Multi-armed Qini curve: expected gain vs spend. Source — grf-labs docs.
⚠️ Unofficial community write-up of a method from grf-labs/maq (pinned at
main). Not affiliated with the grf-labs authors — this summarizes the public documentation for demonstration. All credit & copyright belong to the original authors (Athey, Tibshirani, Wager, et al.).
What it does
Extends Qini curves to settings with K arms and arm-specific costs. Given doubly-robust scores and a cost matrix, maq traces the Pareto frontier 'expected gain vs total spend' by spending each marginal unit of budget on the unit-and-arm with the highest gain-per-cost — and reports CIs.
library(maq)
# DR.scores: n × K, cost: n × K (or 1 × K for arm-level costs)
mq <- maq(DR.scores, cost, R = 200)
plot(mq)         # Pareto curve
average_gain(mq, spend = 0.3)
Pairs with
multi_arm_causal_forest for the scores, and policytree once you've picked a budget. Sister package to GRF, MIT-licensed at grf-labs/maq.
Used in these workflows (1)
-
Qini curves: automatic cost-benefit analysis
From CATEs to a budgeted treatment policy: causal forest → DR scores → cost matrix → maq Qini curve → pick the budget.
Finally a Qini that handles K arms AND per-unit costs honestly. The Pareto-frontier view is the right mental model for budgeted targeting.
Stakeholders get it the moment they see the spend-vs-gain curve. Game-changer for ops conversations.
Pairs nicely with policytree once you've picked a budget. CATEs → DR scores → maq for the frontier → policytree for the rule.